
How CIMCO MDC-Max Makes Lights-Out Manufacturing Work
In theory, lights-out manufacturing sounds great. You load the machines, head home for the night, and wake up to a pile of finished parts. But
Your Smart Manufacturing Partner
How efficient are your machines? If the answer relies on gut instinct, a walk through the shop floor, or a spreadsheet manually updated at the end of the shift, it may be time for a better way to measure performance.
If you’ve ever discovered a machine sat idle for hours without anyone noticing until the end of the day, or struggled to justify replacing equipment without reliable production data, CIMCO MDC-Max changes that conversation.
CIMCO MDC-Max is a real-time machine monitoring and data collection platform designed to give manufacturers complete visibility into shop floor performance. By automatically and continuously capturing machine data, MDC-Max transforms raw information into actionable insights through live dashboards, production reports, OEE metrics, and real-time alerts.
With MDC-Max, you no longer have to be physically on the shop floor to understand what is happening across your operation. You gain the visibility needed to improve productivity, reduce downtime, and make confident, data-driven decisions.
At its core, MDC-Max connects to your CNC machines through whatever interface they support and listens for events. Whether that’s Fanuc FOCAS, Haas M-Net, MTConnect, Heidenhain Opt18, NETLink PRO, RS-232, or hardware I/O signals wired directly into the machine.
Cycle start. Cycle stop. Feed hold. Alarm. Part complete.
These events flow into a central server, are processed against your configured schedule and shift patterns, and become the raw material for everything else the system does.
That “everything else” is substantial.
MDC-Max can show you a live color-coded status screen of every machine in the shop on a big screen TV on the floor, a tablet at someone’s desk, or a phone in a manager’s pocket. It can generate OEE reports broken down by machine, operator, shift, job, or any combination of these. It can send an email or SMS the moment a machine has been sitting in an alarm state for longer than the threshold you define. It can push data to your ERP or MES system so your production records reflect what actually happened, rather than what someone estimated at day’s end.
The system is built around a client-server architecture. The DNC-Max server handles the communication and data transport. The MDC-Max engine processes the events and runs the logic. The PC client and web client give you the configuration interface and data views. Once it is set up and running, most of the operation is automated.
Overall Equipment Effectiveness (OEE) is one of the most widely used performance metrics in manufacturing because it measures how effectively your production equipment is actually being utilized. By combining availability, performance, and quality into a single percentage, OEE reveals how much of your true production capacity is being converted into productive output.
An OEE score of 85% is widely recognized as a world-class manufacturing benchmark.1,2 Many manufacturers operate well below world-class OEE benchmarks, leaving significant room for productivity improvement. They often discover substantial hidden capacity once machine performance is measured accurately and consistently.
MDC-Max calculates OEE automatically once the system is configured correctly. Availability is determined by comparing actual machine uptime against planned production schedules. Performance is calculated by comparing actual cycle times to your ideal part time, which can be pulled from CIMCO NC-Base, entered manually via an operator screen, or fed in from an external system. Quality is measured using your good part counts versus total parts produced tracked through signals and counters you’ve configured for each machine.
The OEE setup in MDC-Max is expression-driven, which means you define what “running” means for each machine, what counts as a good part, what counts as unplanned downtime versus planned downtime like maintenance windows, and the system handles the math from there. You can have multiple OEE configurations for different machine types or different production scenarios running simultaneously.
Where this becomes genuinely useful is not the overall number, but the breakdown. For example, when you look at a report and see Machine 4 had 82% availability last week but only 61% performance, you know the machine was mostly running, but slower than it should. That is a different problem than Machine 7 showing 70% availability and 90% performance, which tells you the machine runs great when it’s running, but it’s stopping too often. These are two fundamentally different production problems requiring different corrective actions. Without accurate machine data, the distinction is difficult to identify. You see the difference when you have the data.
Most MDC-Max installations stop at the built-in reports, which is understandable, but it leaves a significant capability untouched.
MDC-Max stores all of its production data in a MySQL database that can be directly connected via ODBC from Excel, Power BI, Tableau, Grafana, or any other reporting tool which speaks SQL.
More importantly, exactly what gets stored and how it’s structured can be configured through a feature called Real-time DB Tables. This is one of the more powerful tools we can set up for customers during the MDC-Max implementation.
Real-time DB Tables are custom database tables which can be created and configured inside the MDC System Setup.
Unlike standard MDC reporting tables, which are calculated on-demand and tied to a shift schedule, Real-time DB Tables log data continuously based on defined conditions, independently of any schedule. They are purpose-built for two things: feeding external systems and serving as the data source for MDC-Max’s Historical Dashboards.
Every custom table gets stored in the MDC schema in the underlying database with a valtb_ prefix on the table name. The base structure of each table is consistent: a machine identifier, a state column, start and end timestamps, a name field, and up to 30 custom data columns that can be configured to capture whatever production values matter most for a given operation. What goes into these columns is driven by MDC expressions which pull values from anywhere in the MDC system the moment a row is opened or closed.
The Timeline table is the most used for job and machine state history. It works by maintaining a prioritized list of conditions, one for each state to be tracked, such as Cycle Running, Alarm, Setup, or Planned Downtime. Whichever condition is true and highest in priority becomes the active state. When the condition changes, the current row closes and a new one opens automatically. The result is a continuous, gapless record of machine state history which can be queried directly or fed into a Historical Dashboard.
The Program/Log table offers more precise control through explicit OPEN, CLOSE, and LOG conditions, making it well-suited for tracking discrete events like job starts and ends, tool changes, or any event-driven data point which does not fit neatly into a state-based model.
This is where Real-time DB Tables become genuinely powerful for job history. When a row opens, closes, or updates, MDC-Max evaluates the configured expressions for each custom column and writes those values into the table.
Fields like current job name, NC program that was running, logged-in operator, cycle time from a Timer, part count from a Counter, spindle override, or feedrate, can all be captured and stored in named, queryable columns.
For customers who need a historical job log that captures the machine, job name, operator, program, total cycle time, and part count for every completed job, MDC-Max can be configured to automatically generate that record using a Program/Log table structure. OPEN and CLOSE conditions are tied directly to job start and stop messages, while custom columns pull data from the relevant timers, counters, and text variables already available within the system.
As each job completes, a clean, fully populated record is automatically written to the table, eliminating manual data entry, post-processing, and export steps entirely.
Once the tables are collecting data, connecting an external reporting tool is straightforward.
On the Windows side, DSN is configured using the MySQL ODBC connector in the 64-bit ODBC Data Source Administrator, pointed at the server running the MDC-Max database on port 3306 with credentials from the MDC-Max Database Setup.
From there, Excel connects via Data > Get Data > From ODBC; Power BI uses the MySQL connector in Get Data; and Tableau connects through its native MySQL connector.
The custom tables configured in MDC-Max appear as queryable tables in whichever tool is being used. Reports or dashboards can be built directly on top of live production data.
PRO TIP FROM THE SHOP FLOOR:
Before building dashboards or reports on top of a Real-time DB Table, we always let the table run for at least a full production shift and review the raw data first.
The check is straightforward: confirm rows are opening and closing at the expected times, that timestamps align with actual machine events, and that custom column values are populating correctly.
Getting the expressions right in the source configuration is where the real work is.
Once the data is clean, everything built on top of it stays clean.
Troubleshooting bad data after a dashboard has already been presented to management is a much harder conversation than catching it during commissioning.
The Machine List is CIMCO MDC-Max’s real-time status screen.
Each machine appears as a color-coded row showing its current state, and you configure what those colors mean. Green for running, red for stopped, yellow for feed hold. Whatever maps to the way your team already thinks about machine status. You can add secondary indicators alongside the primary state color, so a machine can show green for running while also displaying a small amber indicator flagging an active alarm that has not yet stopped the cycle.
The Shop Floor Screen takes this a step further with a physical layout of your facility. Machines appear positioned where they actually sit on the floor. Color-coding works the same way, but now a manager walking through the door can glance at a wall-mounted screen and immediately see the status of the entire floor in spatial context rather than as a list.
Both screen types run in the web client as well, which means they display on any browser, any device, any screen. A supervisor can have the live screen on a second monitor at their desk. A plant manager can check it from home on their laptop. A quality engineer can pull it up on a tablet while walking the floor. The data is the same regardless of where you look at it.
CIMCO MDC-Max also supports full-screen mode and slideshow mode. A TV mounted on the shop floor wall can cycle through multiple screens automatically, showing the machine list, then an OEE summary, then a timeline view, without anyone touching it.
Real-time status tells you what’s happening right now.
Reports tell you what happened, why, and what to do about it.
CIMCO MDC-Max ships with over 100 configurable report templates covering machine timelines, OEE breakdowns, downtime by reason code, cycle time analysis, shift comparisons, operator performance, and more.
The timeline graph is one which gets the most use in day-to-day operations. It shows each machine as a horizontal bar across a time axis, color-coded by state, so you can immediately see patterns. A machine that runs green for four hours, then drops to red for 40 minutes every afternoon like clockwork is a maintenance or tooling issue you can now identify and address. A machine that shows scattered short red periods throughout the day presents a different problem than one that runs solid green and then drops for a single long stop.
Reports can be filtered by machine, machine group, operator, shift, date range, and interval length. An interval of one hour on a daily report gives you a row per machine per hour, which is the level of granularity where most scheduling and bottleneck problems become visible. Zoom out to daily intervals over a month and you have a production capacity picture that supports capital planning conversations.
All reports can be exported to Excel. And if you configure Excel templates in the system, those templates are stored in the MDC database, so every user pulls from the same version. No one is working from a template they downloaded six months ago and have quietly modified.
Automatic data collection tells you a machine stopped. It cannot tell you why the machine stopped unless you set up the context collection to go with it. CIMCO MDC-Max handles this through operator screens, which are configurable touchscreen interfaces that operators use to log downtime reasons, job information, part counts, shift changes, and anything else you need captured manually.
Operator screens run on any PC, tablet, or phone with a browser. An operator whose machine just went down sees the stop reflected on their screen and gets prompted to select a reason from a list you have configured: waiting for material, tooling change, setup, quality hold, maintenance call, whatever categories make sense for your facility. That reason code gets logged against the machine and the time window and shows up in your downtime reports broken out by category.
This combination makes MDC even more useful. The machine tells MDC-Max it stopped, and the operator tells MDC-Max the reason why. One without the other gives you incomplete data. Together, they give you the actionable picture. Downtime by reason code is the report that typically produces the most immediate process changes, because suddenly everyone can see that 34% of your weekly downtime is waiting for material. Now the conversation about fixing this becomes unavoidable.
Real-world example: A shop we were working with had long been running with a vague sense that one of their VMCs was underperforming.
Once CIMCO MDC-Max was utilized, the timeline reports showed the machine was actually achieving excellent availability and performance when it was running, but it was sitting idle for an average of 47 minutes at the start of every shift.
Turns out the operator for that machine was also responsible for morning inspection of a different cell and was consistently delayed getting to the VMC.
A scheduling adjustment recovered nearly an hour of production time per shift per day on that machine alone. This is the kind of insight that pays for the system.
CIMCO MDC-Max can send email, SMS, or third-party messaging app notifications (including Slack and Telegram) triggered by any machine event or condition you define using its expression engine.
A machine enters an alarm state for more than 10 minutes: email the maintenance lead. A daily OEE report at shift end: email the production manager. A machine exceeds its planned cycle time by 20%: SMS the supervisor.
The notification system supports scheduled triggers as well, so you can configure a weekly summary report to send every Monday at 6:00 AM regardless of machine events.
You can also combine a scheduled trigger with an MDC expression, so the notification only fires on the schedule if a specific condition is also true, which gives you very precise control over who gets notified about what and when.
CIMCO MDC-Max does not operate in isolation. It gets significantly more capable the more of the CIMCO stack you run alongside it.
When paired with CIMCO DNC-Max, the program that ran on Machine 7 at 2:15 PM is automatically logged against the MDC timeline. Your production records and your program transfer records will tell the same story.
When NC-Base is in the picture, expected part time for OEE calculation can be pulled directly from the program record in the database rather than entered manually.
When CIMCO MDM is running, job documentation, setup sheets, and quality records are tied to the same production events MDC-Max is tracking.
We have written about how CIMCO Software functions as Industry 4.0 middleware. It is worth reading if you are thinking about MDC-Max as part of a broader digital transformation, rather than just a standalone monitoring tool.
The integration story is a significant part of why shops that implement the full CIMCO stack see compounding returns from each product.
If you are just starting to think about machine data collection and want a practical guide for what a real installation looks like, our article on planning your MDC installation is a helpful starting point. It covers connection methods, hardware considerations, how to think about which data points to capture first, and how to avoid most common setup mistakes.
REAL TIME PRODUCTION VISIBILITY
Gain instant insight into machine activity, downtime, and production performance across the shop floor. Real-time dashboards and mobile monitoring help teams respond faster and make better production decisions.
Production Analytics & Performance
Automatically collect accurate manufacturing data and turn it into actionable performance insights. Built-in reporting tools help manufacturers identify bottlenecks, reduce downtime, and improve overall equipment effectiveness (OEE).
Automation & Smart Manufacturing
Support smarter manufacturing with automated alerts and seamless system integration. MDC-Max helps manufacturers improve unattended machining operations while connecting production data across business systems.
Connectivity & Scalability
Connect both modern and legacy CNC equipment using flexible communication options. MDC-Max scales easily from small machine shops to enterprise-wide manufacturing environments.
CIMCO MDC-Max is available for a free for 30-day evaluation.
If you want to talk through what a realistic MDC installation looks like for your specific machines and facility, understand what connection hardware you need, or see a live demo of the dashboards and reporting, contact us directly.
Machine data collection is one of the highest-leverage investments a shop can make, and we have been doing these installations long enough to know exactly what works and what to avoid.
We have been implementing and supporting CIMCO products since 2006. With 20+ years of experience, we know these tools inside and out, backwards and forwards. Our extensive experience with these implementations has shown us what works, what to avoid, and how to get your team successfully using the system from day one, not six months down the road.
The data is already there. Your machines are generating it every cycle. MDC-Max is how you capture it.
Start your free 30-day Demo of CIMCO products today.

In theory, lights-out manufacturing sounds great. You load the machines, head home for the night, and wake up to a pile of finished parts. But

This article describes the process for separating MDC-Max from the DNC-Max service. This can be useful for troubleshooting a problem in your configuration. It is

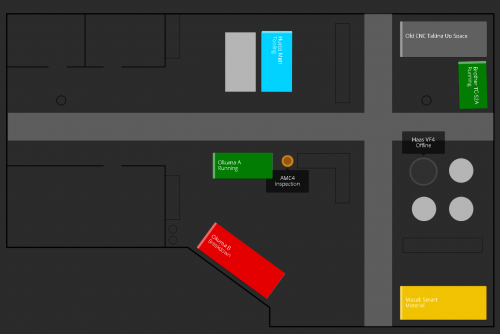
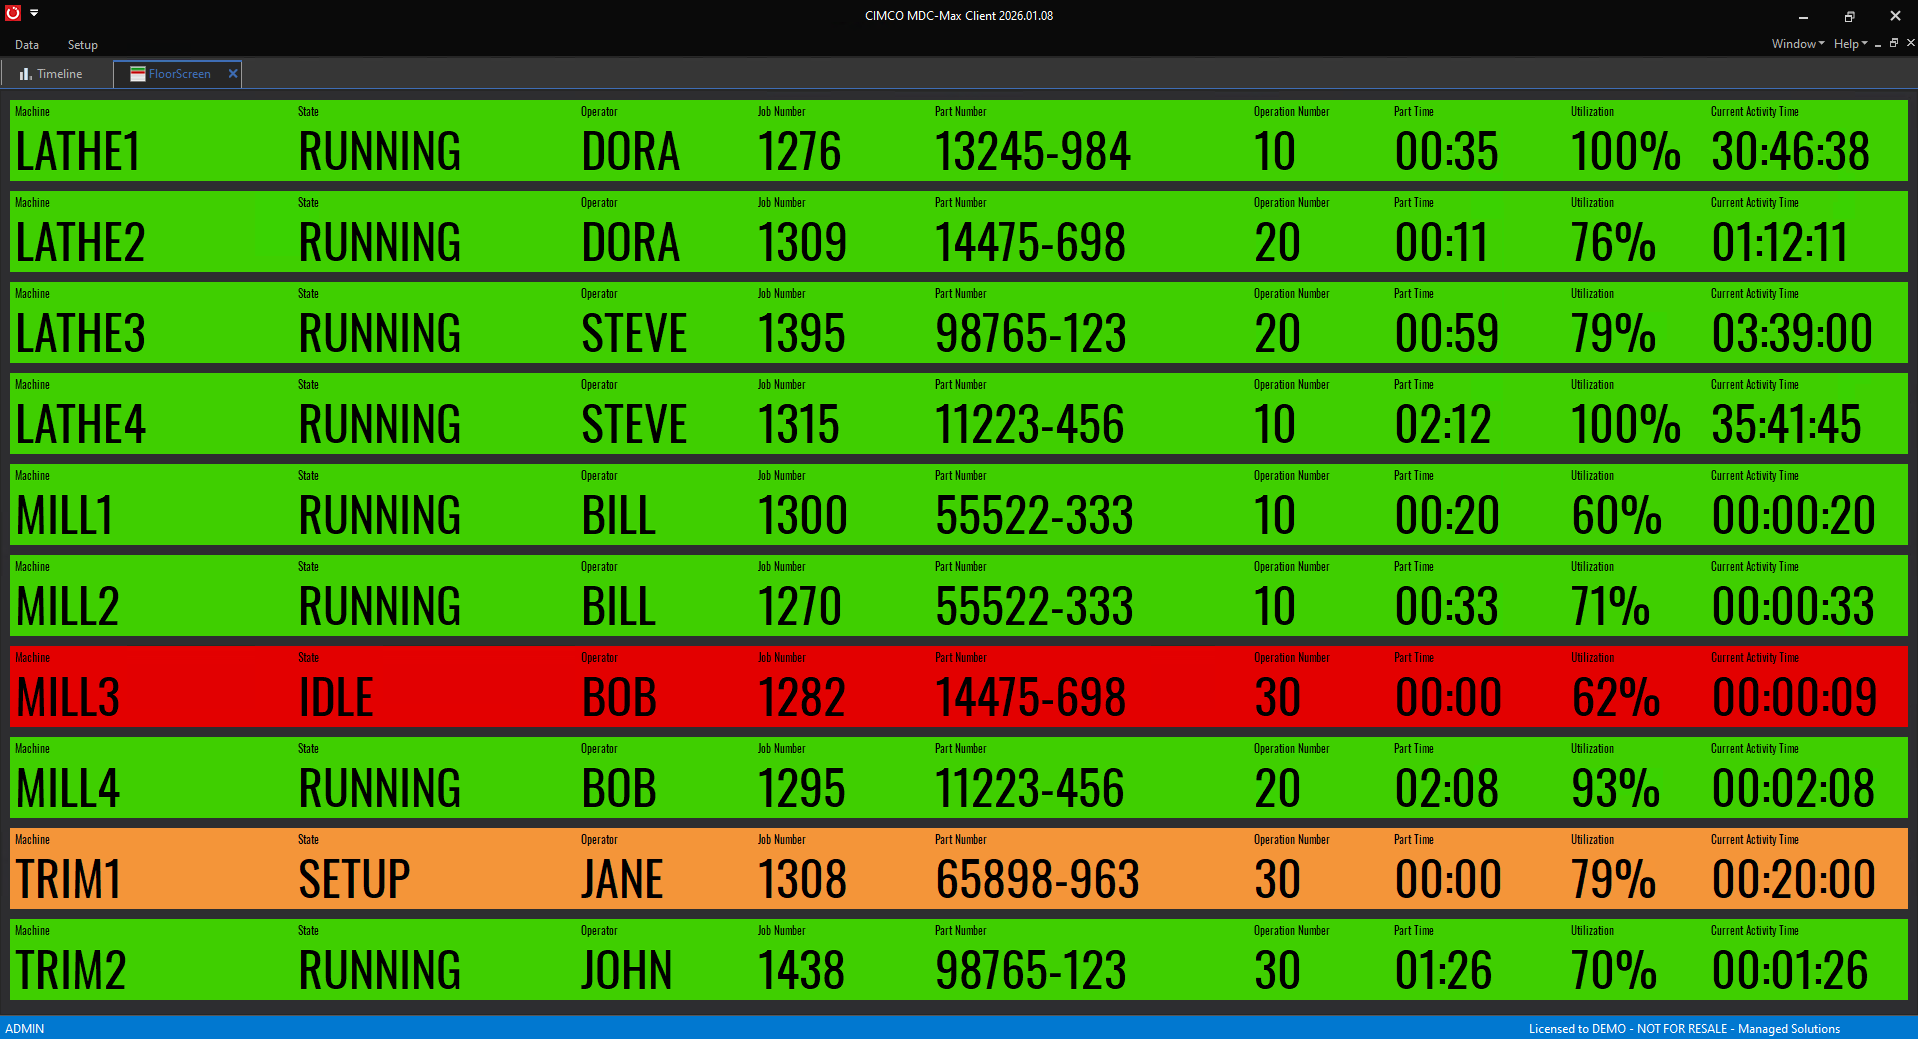
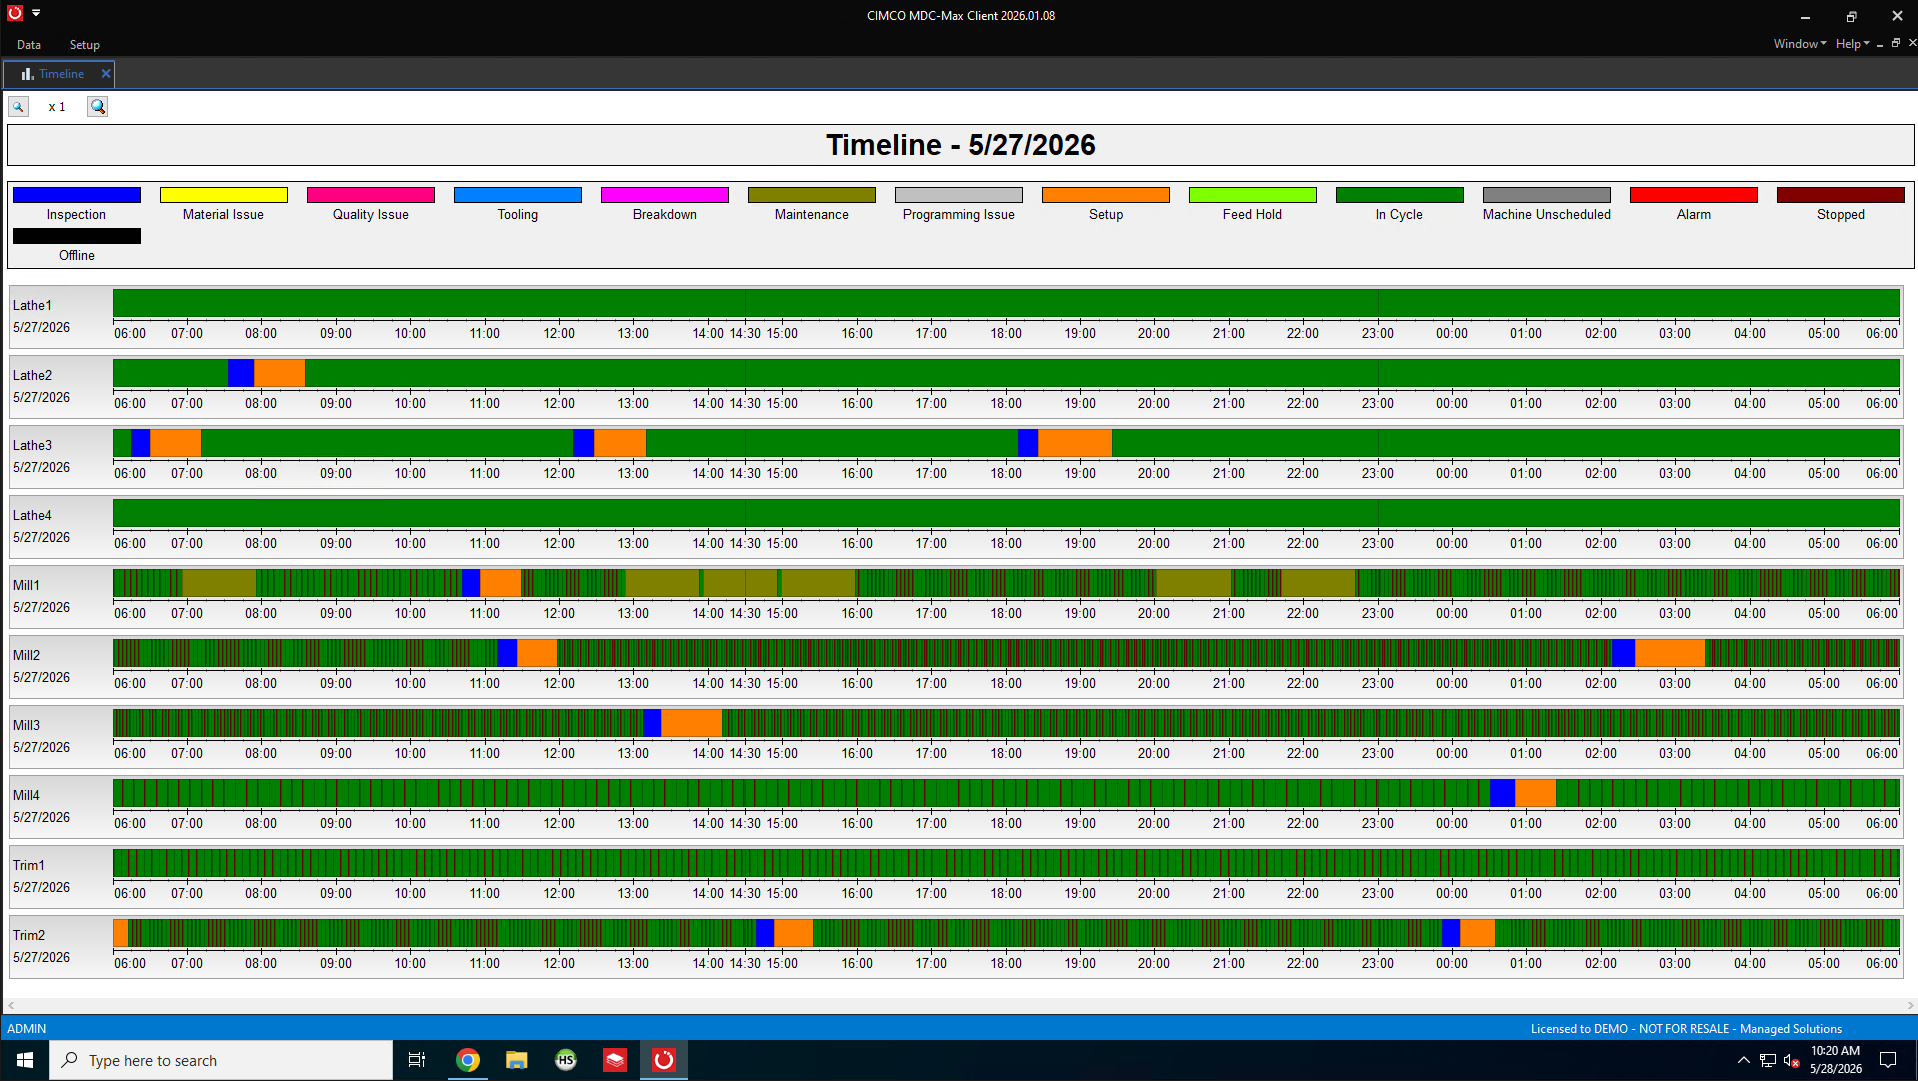
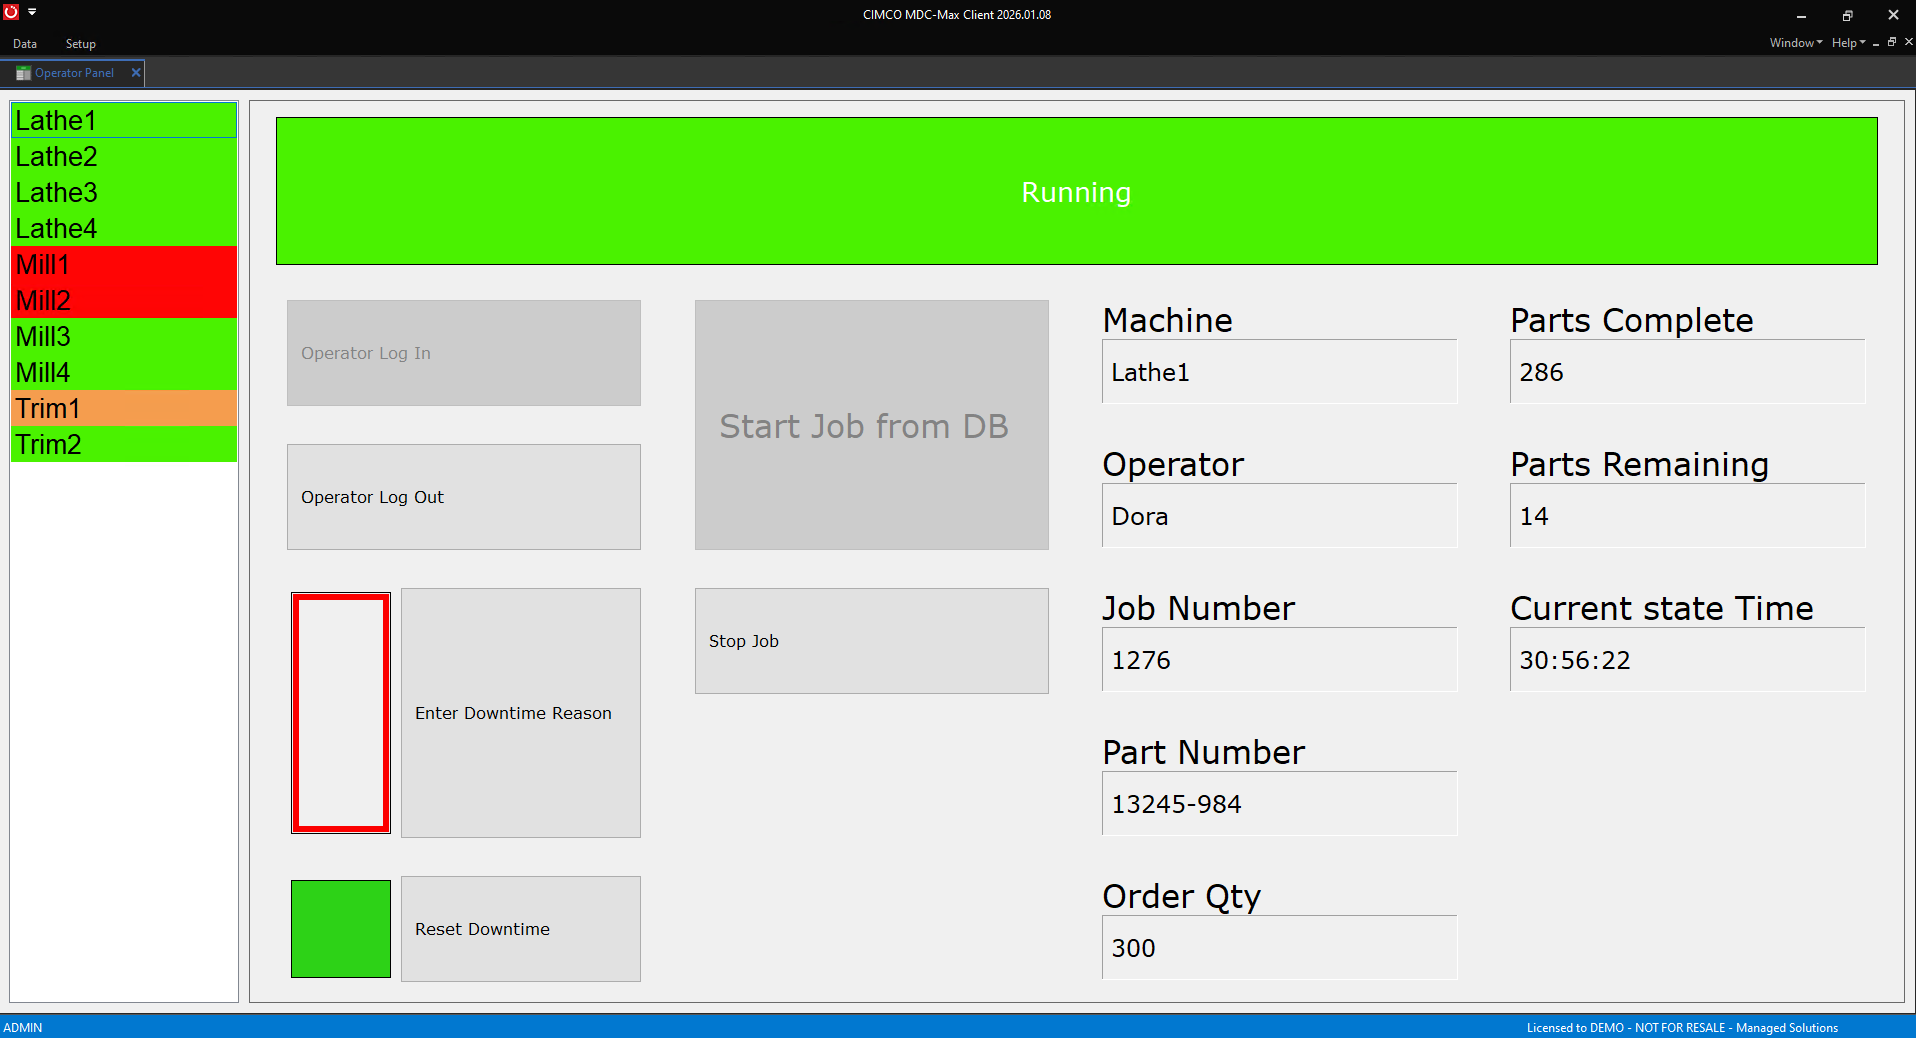
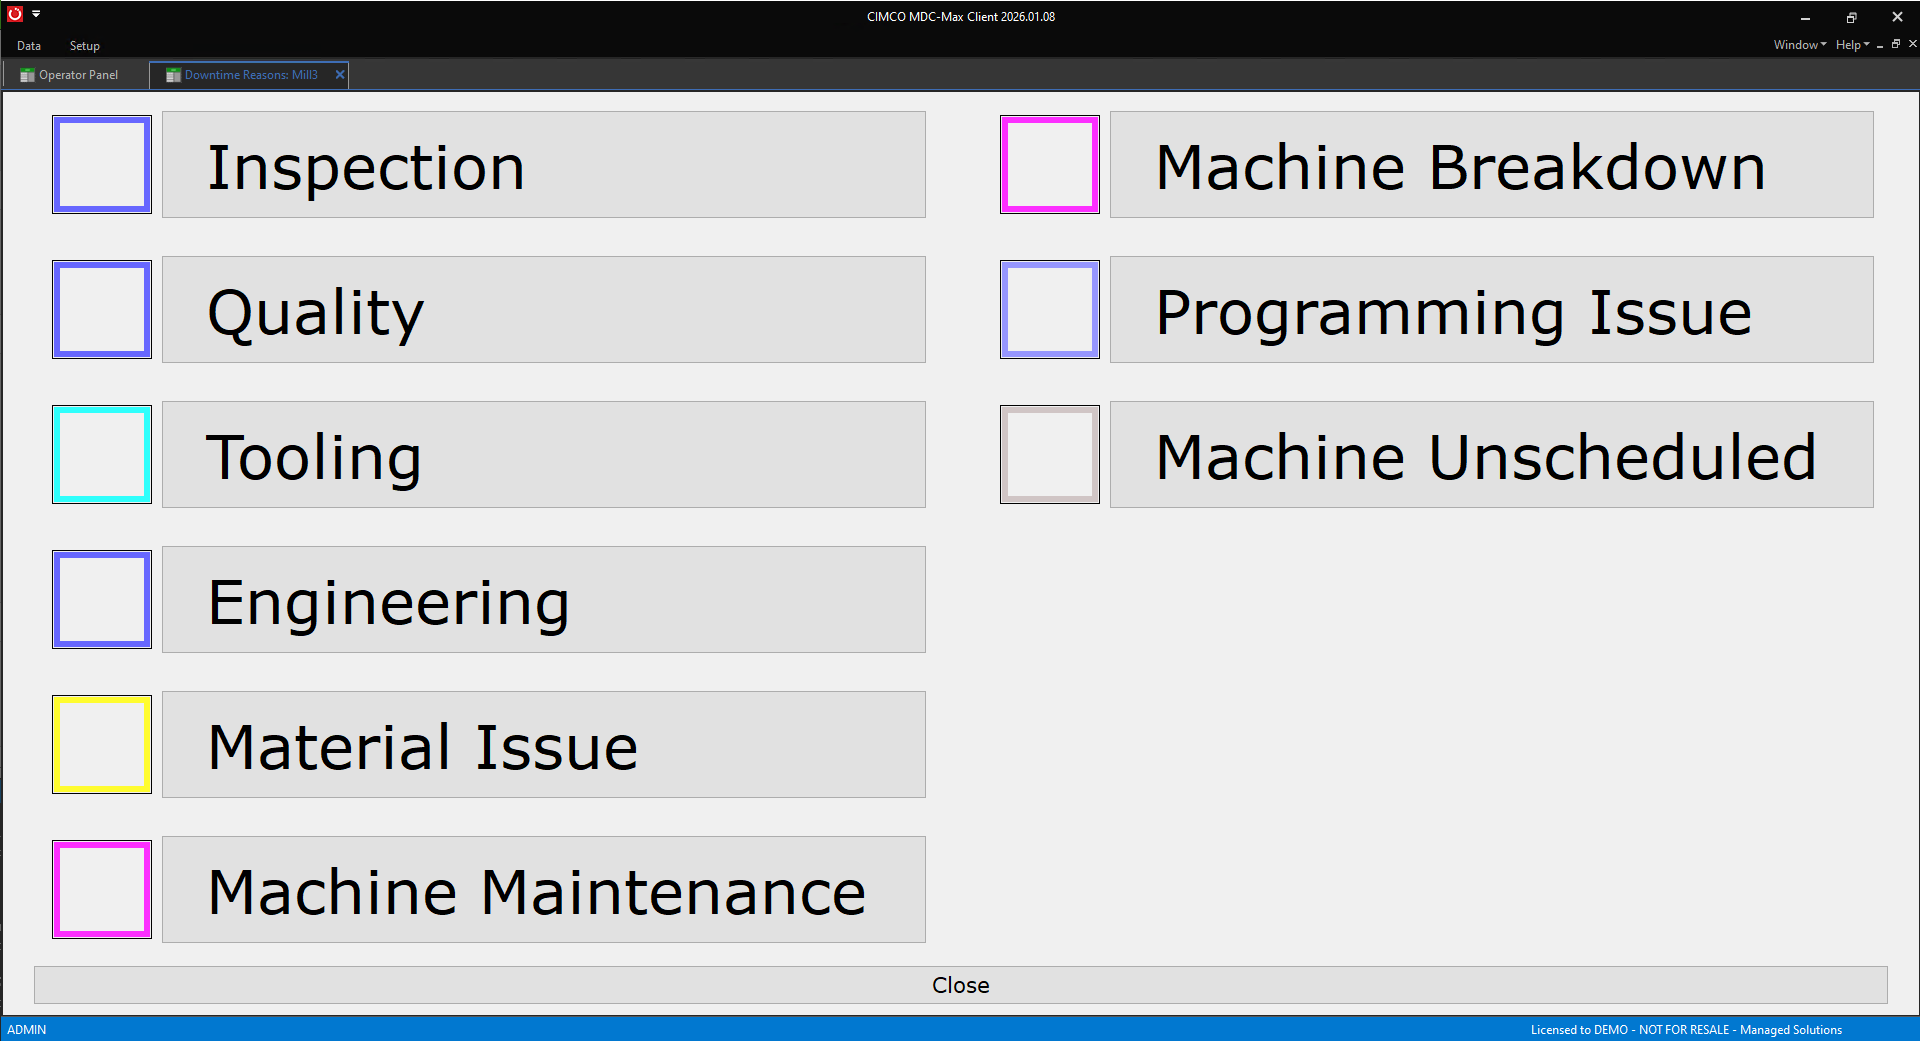
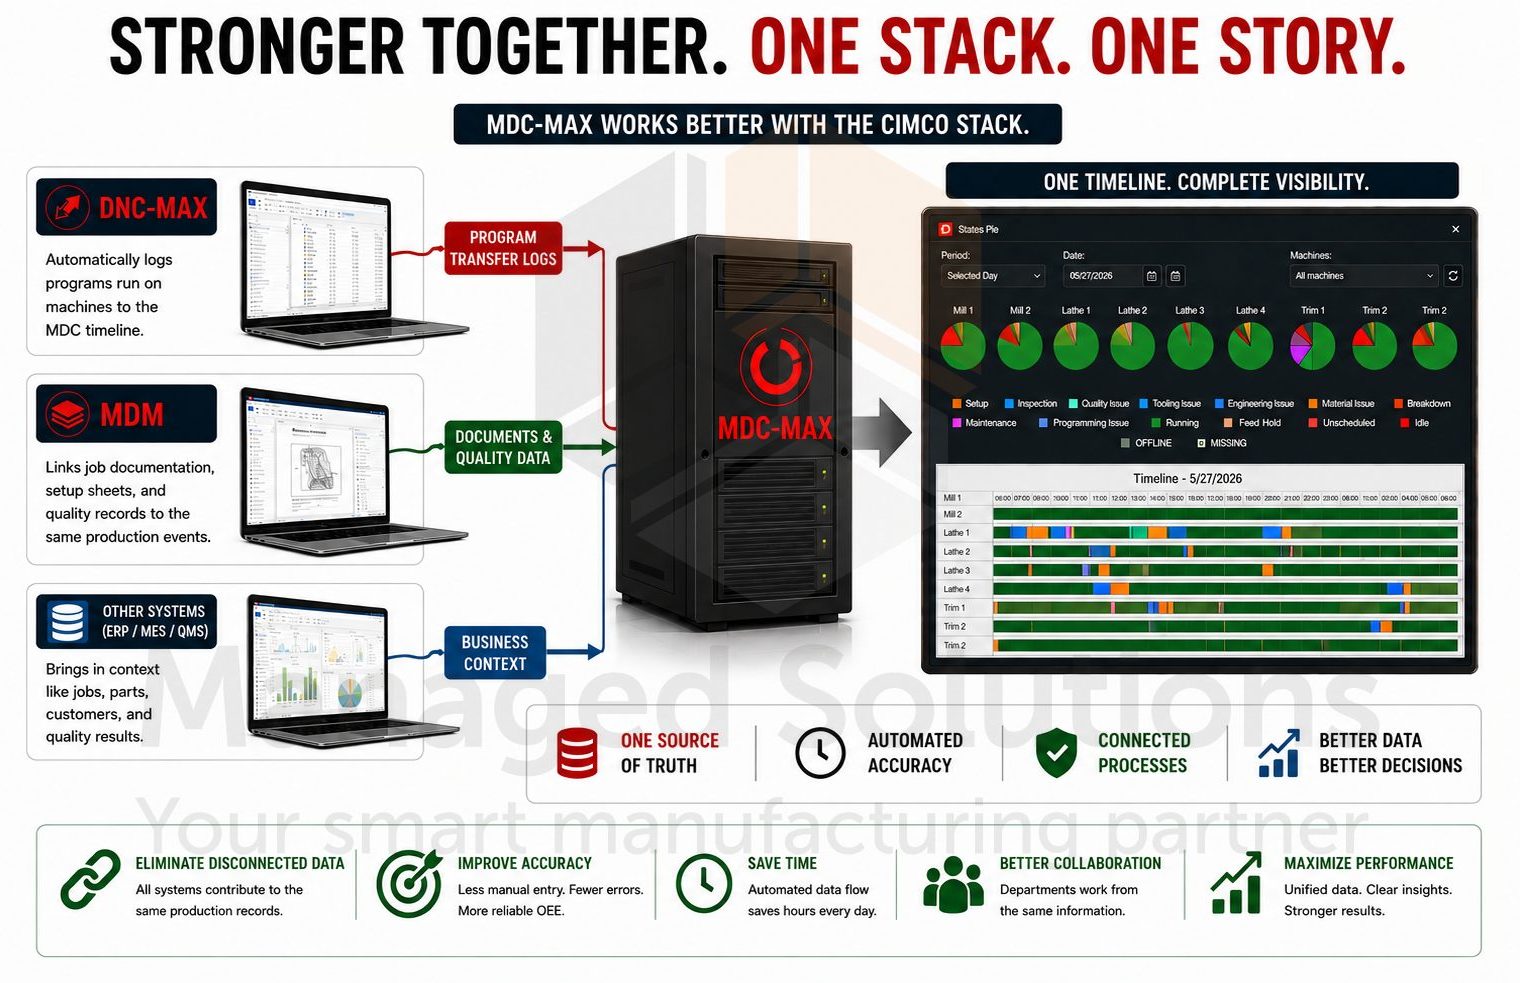
It’s official, CIMCO A/S has released Shop Floor Screens for CIMCO MDC-Max. This useful feature will allow you to visualize your environment and view real